Custom charts and more
Today, we're happy to introduce version 1 of custom completions charts. We also shipped a few minor improvements and fixed some smaller bugs.
Custom charts
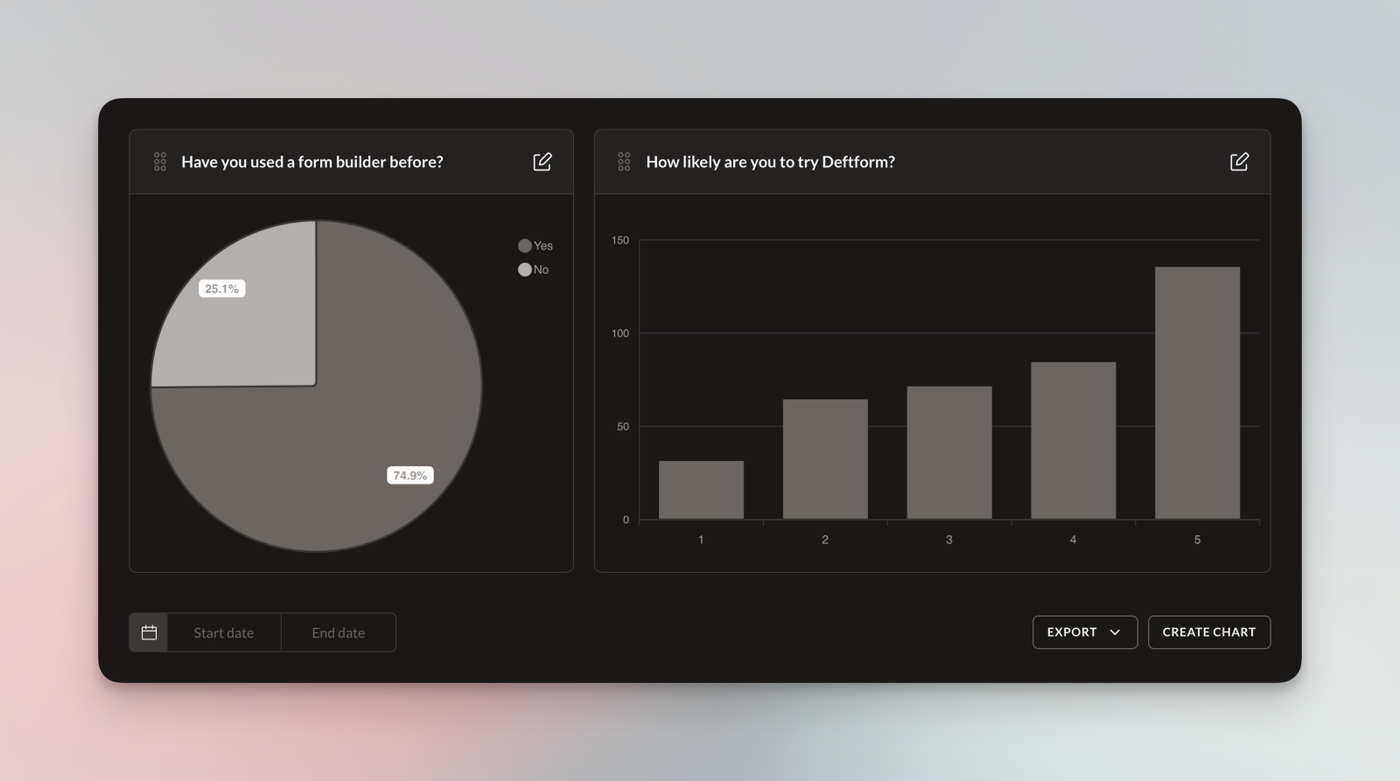
Version 1 of our custom completions charts is now available. To create a chart, go to the "Responses" view of a specific form. The "Create Chart" button is currently located next to the "Export" button.
You may create a chart with any of the currently supported field types "Single choice", "Multiple Choice", "Dropdown", "Country" and "Rating".
We may still change a few minor things in the next couple of days. If you have feedback, feel free to use our support widget (located in the lower left corner when logged in).
Multiple webhooks per form
It is now possible to attach multiple webhook endpoints to forms. Previously, only one endpoint could be added. It turns out that a few of our customers have a need for this, and we're happy to offer this now.
Changes, improvements, fixes
When adding a new page break to a form, it's now added at the bottom of the fields. Previously, it was added to the top, which slowed down form creation due to the need to scroll up and down frequently.
We also improved the loading time for the forms overview page. Statistics are now lazy-loaded, which improves page load significantly in many cases.